How To: Infographic Builder

Find here icons, statistics, and ideas to help you create infographics for your campaign.

1. Think about your message

  • What problem do you want to see solved?
  • What response do you want from individuals or leaders?
  • What facts will convince your audience

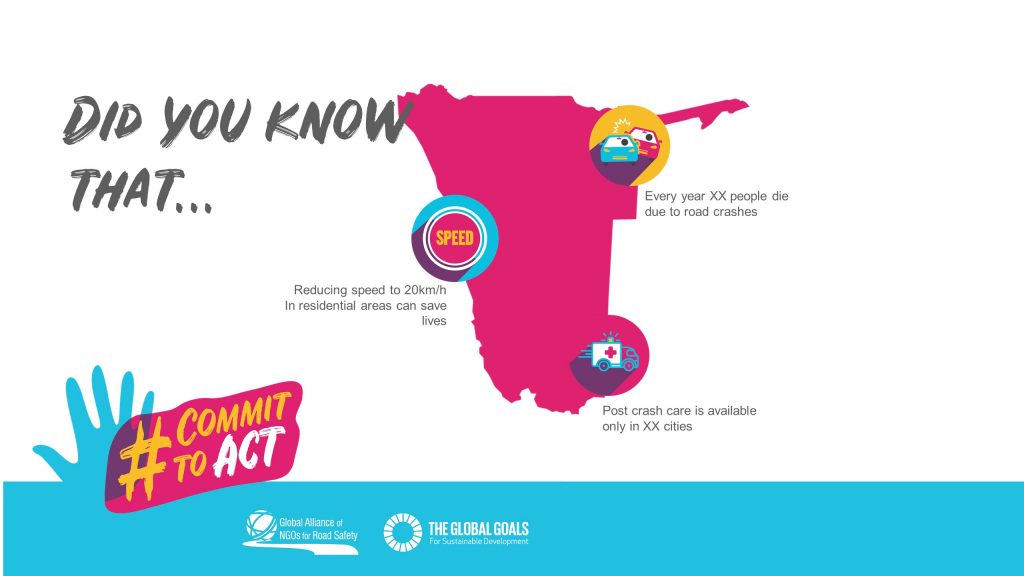
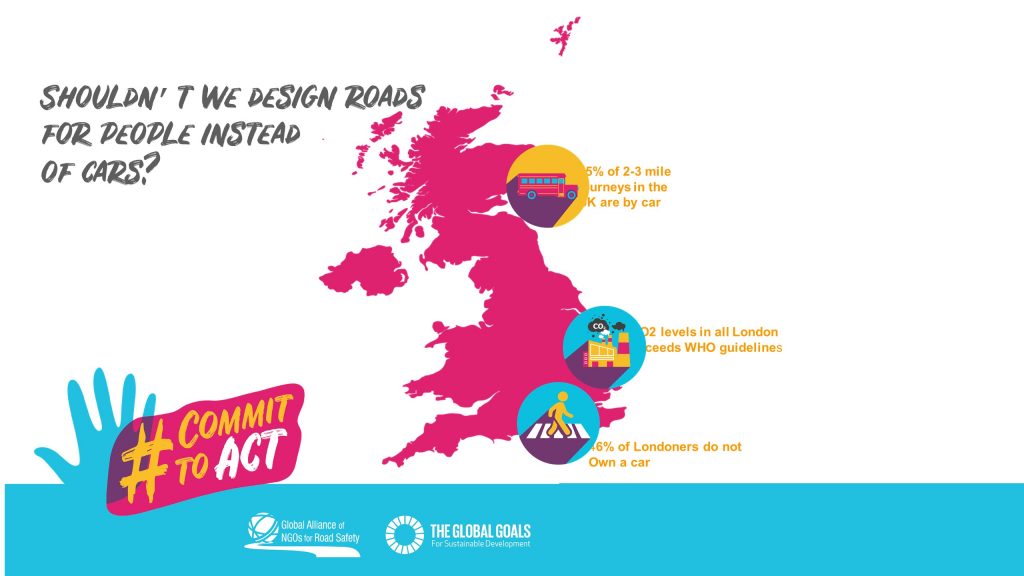
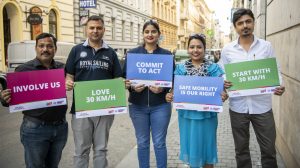
Your message could be a question e.g. “Are our roads ready for the new normal?” or “Shouldn’t we design our roads for people not cars?”; or a demand e.g. “We need 30km/ph roads to save lives.”

2. Find relevant data and statistics

Choose three to four relevant facts or statistics to make your point. Some good global sources of information include:

3. Find your country icon

Find countries in blue
Find countries in pink
Find countries in yellow

4. Choose your icons

Choose and download your icons.

5. Design your infographic

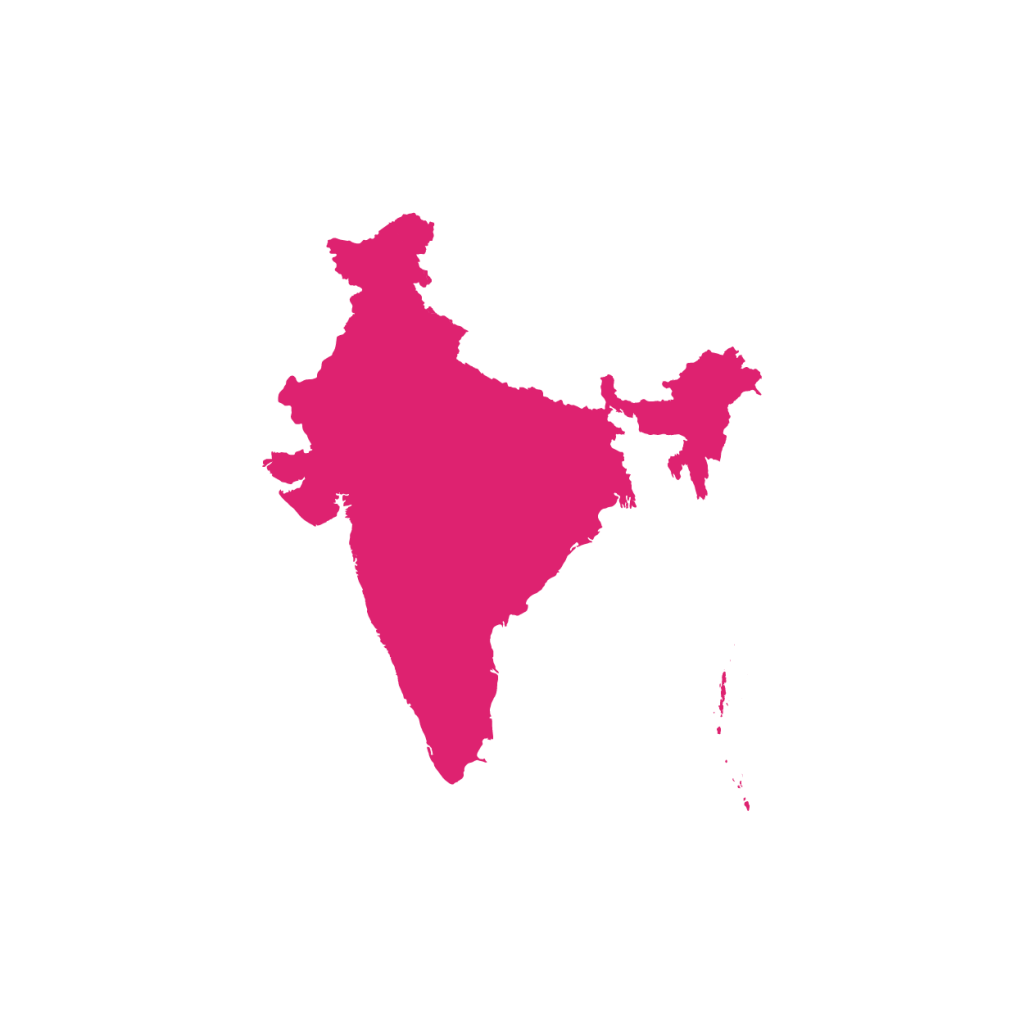
Layout your country icon, safety icons, and facts.

Download the frame/logo here:

Standard campaign colors used are:

  • Blue: #13BFDF
  • Yellow: #F9BE2B
  • Pink: #DF2370

Fonts (download the fonts by clicking the links):

  • Headings: CAVEAT or RUSTICO
  • Paragraph: OPEN SANS or HELVETICA NEUE

6. Final touches

  • Add your NGO’s logo
  • Convert your infographic into a jpg or png file for social media or pdf for printing/sharing via email

See some examples