Contact
·
EN | ES
·
Login|
Create Account

Lowering legally-allowed maximum speed limits using speed limit signage to provide safe mobility for all road users. Lower speed limits are most effective when supported with traffic calming measures and/or enforcement to increase compliance with the legal limit.
Roads where deaths or serious injuries occur among any road users from road crashes, regardless of the road function;
and/or
Roads of poor safety quality;
and/or
Areas where pedestrians need to cross or walk along the road, where vehicles enter and drive through a built-up area or where people walk and/or bike. In practice, this would include residential areas, villages, markets, retirement villages, school zones, healthcare, and hospital precincts, around places of worship, university hubs, public transport hubs and major train station zones, city centers, central business districts (CBD), and possible conflict points.
The Global Plan for the Decade of Action for Road Safety 2021–2030 (Global Plan)[3] sets a target to reduce road traffic deaths and injuries by 50% by 2030. Achieving this target requires implementation of evidence-based interventions that are known to reduce road traffic deaths and injuries. Lower speed limits are one such evidence-based intervention.
There is a strong relationship between speed and crash risk—the higher the speed, the greater the probability and severity of a crash. Therefore, the lower the speed, the greater lifesaving and injury reduction benefits. For example, a 10% decrease in mean speed leads to a 40% decrease in fatal crashes.[4]
In principle, a 1% reduction in average speed results in an approximate 2% decrease in injury crash frequency, a 3% decrease in severe crash frequency, and a 4% decrease in fatal crash frequency.[5]
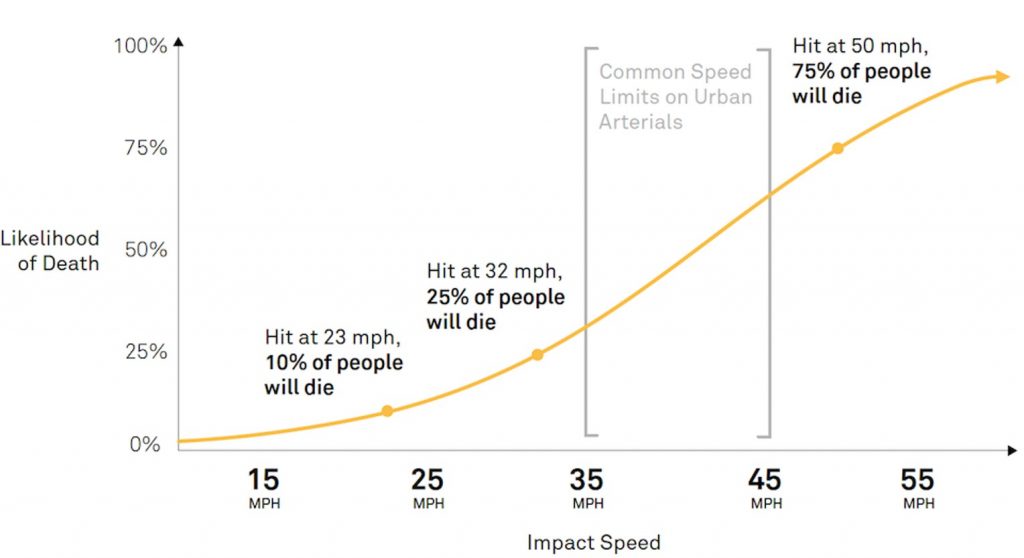
Increased travel speeds lead to an exponential increase in crash related deaths and injuries (Figure 1): 75% of people will not survive a crash if hit by a car traveling at 50 mph (approximately 80 km/h). That reduces to 25% when the impact speed is 32 mph (approximately 51 km/h) and continues to decline as the speed of impact decreases.[6]
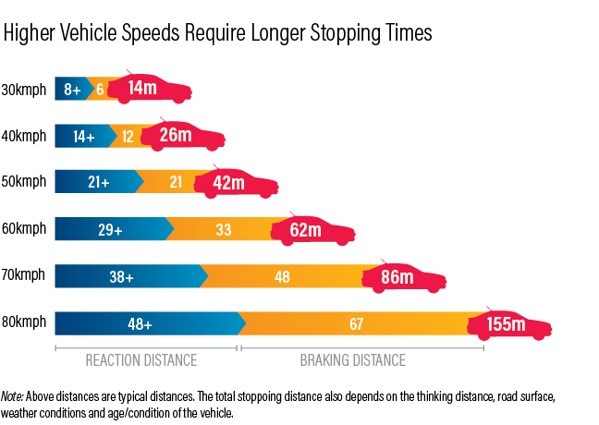
A driver traveling at a higher speed will require a longer reaction and braking distance, increasing the probability of hitting a pedestrian, cyclist, or another vehicle. A car traveling at 30 km/h takes approximately 14 meters to come to a full stop but at 80 km/h, it takes a much longer distance at 155 meters (Figure 2).
Higher travel speeds also affect a driver’s peripheral awareness due to a narrower field of vision. This impedes their ability to quickly predict or detect potential conflicts on the road.[9] Lower travel speeds give more time and space for drivers and other road users to react and make decisions when errors occur.
Even small reductions in speed limits can result in safety gains. A 10% reduction in average speed in a city achieved through lower speed limits can result in 19% fewer injury crashes, 27% fewer death and serious injury crashes, and 34% fewer fatal crashes.[10] On the other hand, a 5 mph (approximately 8 km/h) increase in maximum speed limit can result in an 8% increase in fatality rate on interstates and freeways, and a 3% increase in fatalities on other roads.[11]
When existing 30 mph signs spaced one mile apart were replaced with 25 mph signs spaced a quarter of a mile apart on a 1.3 mile stretch of road in Seattle, USA, it led to reductions in 85th and 50th percentile speeds, as well as all crashes and resultant injuries and fatalities.[12]
A crash test[14] showed that at an impact speed of 40 mph (approximately 64 km/h), there was minimal damage into the space around the driver, but at 50mph (approximately 80 km/h), there was noticeable damage to the driver-side door opening, dashboard, and foot area. At 56 mph (approximately 90 km/h), the interior of the vehicle was significantly compromised, with the crash test dummy showing severe neck injuries and damage to its limbs.
Vehicle speed data can be collected inexpensively over days or weeks with minimal effort through simple, robust, and readily available technology. This allows for a relatively quick demonstration of the benefits of lowering speed limits and other speed-reduction interventions. Because it is a relatively low-cost, rapidly implementable intervention that can be readily demonstrated for effectiveness, lowering speed limits can be a particularly attractive way to reduce road deaths and injuries.[15]
Speed camera enforcement is associated with a 57% decrease in vehicles exceeding the speed limit, resulting in as much as a 19% reduction in vehicle crashes and a corresponding 21% reduction in severity and fatality.[16] Automated enforcement such as speed cameras can be advantageous because conventional manual enforcement (for example, radar used by traffic police) has not been able to meet up with the global increase in traffic volume and vehicle mileage.[17] Cameras can also spot additional illegal behaviors such as disobeying traffic lights, distracted driving from mobile phone use, and incorrect lane use.[18] Speed cameras also help enforcement in difficult areas such as congested and dangerous areas and reduce the real or perceived issues of bias that comes with traditional face-to-face enforcement.[19]
In Bogotá, Colombia, driver compliance with the speed limit increased from an average of 29% to 86% when 30 km/h speed limit signs were complemented with traffic calming measures.[20]
The Safe System approach is a human-centric approach which dictates the design, use, and operation of our road transport system to protect the human road users.[21]
A Safe System approach means any road safety intervention ought to ensure that the impact speed remains below the threshold likely to result in death or serious injury in the event of a crash. Depending on the level of protection that the road users have and the type of crash, this threshold will vary. Typically, the impact speed must remain below 30 km/h for a pedestrian hit by a vehicle, below 50 km/h for a properly restrained motor vehicle occupant in a side impact crash, and below 70 km/h for a properly restrained motor vehicle occupant in a head-on crash.[22] Lowering speed limits protects all road users.
History shows that countries that have adopted the Safe System approach implement evidence-based interventions, such as lower speed limits, and tend to have the lowest rate of fatality per population and the fastest rate of reduction in fatality numbers.[23]
Lowering speed limits saves lives and reduces the severity of crash injuries, thereby reducing economic costs and positively contributing to a country’s economic growth. The economic costs related to injury and loss of life from traffic crashes include money needed to treat injuries, loss of hours worked, vehicle repair costs, insurance or third-party costs, and costs caused by increased congestion when a crash occurs.
A World Bank study highlighted that halving road crash deaths and injuries could generate additional flows of income, with increases in GDP per capita over 24 years as large as 7.1% in Tanzania, 7.2% in the Philippines, 14% in India, 15% in China, and 22.2% in Thailand.[24]
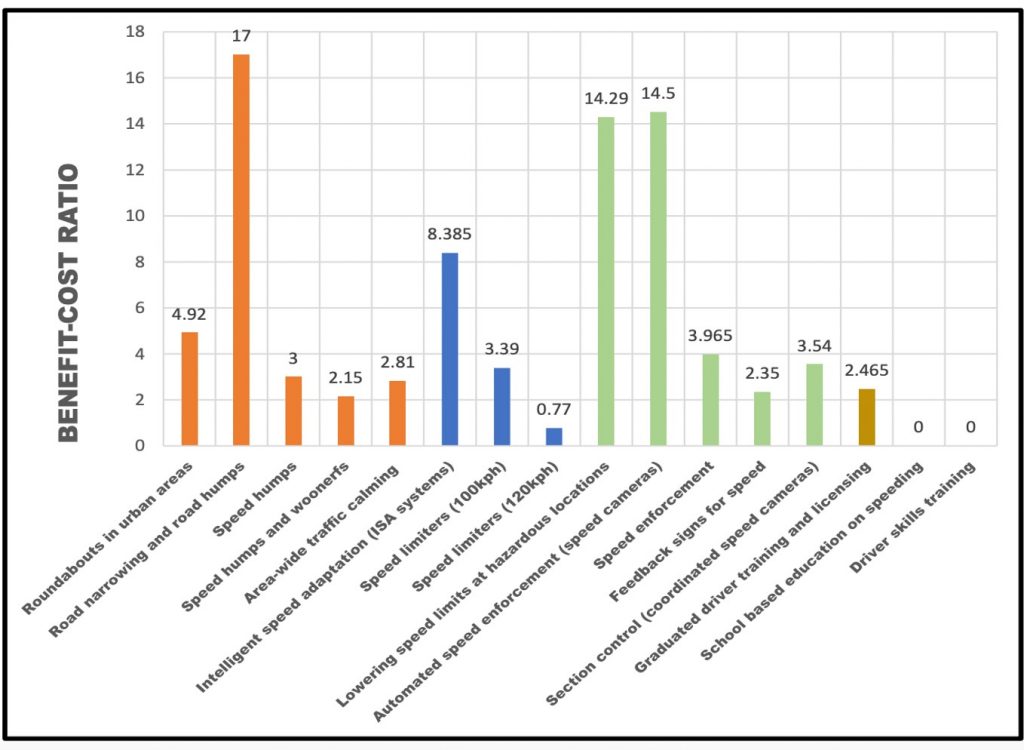
Reducing speed limits has been shown to be one of the most cost-effective speed management interventions achieving a benefit cost ratio of 14.29 (Figure 3). i.e., every US$1 spent on lowering speed limits reaps a US$14.29 benefit.
Small reductions in speed can reduce greenhouse emissions and significantly enhance fuel efficiency. Reducing motorway speed limits from 120 to 110 km/h have been shown to contribute to 12–18% in fuel savings.[26]
Lower speed limits reduce carbon dioxide and nitrous oxide emissions from diesel cars, and particulate matter emission from both diesel and petrol cars, thus reducing air pollution.[27]
Lower speed limits can improve traffic flow and reduce congestion. Reductions in speed limits as vehicles reach congested conditions result in a smoother flow of traffic and less stop/start traffic movement.[28] At lower speed limits, the following distance between vehicles can be shorter (as cars need less distance to stop than at higher travel speeds), and there is improved merging of vehicles from the side streets. This allows the road to accommodate a larger number of vehicles traveling at a constant speed, thereby reducing congestion, and improving travel times.[29] The crash reduction benefits of lower speed limits also improve congestion by reducing the temporary disruptions in traffic caused by traffic crashes.[30]
Lowering the speed limit on major arterials in the city of Sao Paulo in Brazil reduced congestion by 10% during the first month of implementation.[31]
Lower speeds increase opportunities for work and friendship and reduce health inequalities through improved accessibility for road users with restricted mobility, vision, hearing, or mental health, as well as pedestrians, cyclists, children, elderly, youth, and commuters.[32]
In Bogotá, a speed management program targeted five corridors with the highest casualty rates in 2018. The speed limit was lowered from 60 km/h to 50 km/h and speed cameras were set up to enforce compliance. As a result of this program, 46 lives were saved in 2019—a 21% drop in road deaths compared to the average for the three years prior (2015–2018). The interventions were therefore extended to 10 arterial corridors in 2019.[33]
In Fortaleza, Brazil, a speed limit was lowered from 60 km/h to 50 km/h on 16 arterial roads. When before and after crash records on these roads were compared with those on comparable roads, where the speed limit remained at 60 km/h, statistical analysis indicated that the lowering of the speed limits contributed to an average reduction of 68.1% for crashes involving deaths, 29.7% for crashes involving pedestrians, 18.9% for crashes involving injured victims by 18.9%, and 16% for all crashes.[34]
France lowered the speed limit from 90 km/h to 80 km/h on two-way roads without a central median in July 2018. It resulted in a reduction of average speed by -3.4 km/h for all vehicles and 13% fewer fatalities compared to the rest of the French road network. 1,942 people were killed in crashes between July 2018 and June 2019, 209 less than the average number (2,151) between 2013 and 2017.[35]
In New South Wales, the urban speed limit was reduced from 60 km/h to 50 km/h in 1998. The new speed limits were marked with repeater signs and pavement markings and backed by publicity campaigns. Evaluation after 21 months of the program found a 22% reduction in all casualties and 45% reduction in fatalities.[36]
In 1993, in Hungary, the speed limit in urban areas was reduced from 60 km/h to 50 km/h. This policy was imposed on 32% of the state roads. Road deaths were reduced by 18% while average speeds dropped by 8%. The lower speed limit was successful partly due to the intense publicity campaign and police enforcement.[37]
In Oslo, lower speed limits were introduced on three major metropolitan highways in 2004 for environmental reasons. In the years between 2004 and 2007 in the winter months of November and March, the speed limits were lowered from 80 to 60 km/h. Mean speeds on these roads dropped by 7.5% from 76 km/h to 71 km/h and road deaths dropped by 28%.[38]
In Sweden, the speed limit was reduced on many rural roads from 90 km/h to 80 km/h but increased on some high-standard motorways from 110 km/h to 120 km/h. The goal was to meet the needs of the environment and mobility while also adapting the speed limits to the safety classification of each road. On rural roads where the speed limit was lowered from 90 to 80 km/h, the mean speed decreased by 3.1 km/h, and the number of fatalities fell by 41%. On motorways where the speed limit was raised, the mean speed increased by 3.4 km/h, and the number of serious injuries increased by 15 per year.[39]
The following guidance documents can support governments in the design and implementation of traffic calming measures:
Implementing lower speed limits achieves, supports, and/or promotes the implementation of:
Page 11, box 1, point 1, 2, 3, 5, 6, 7: Multimodal transport and land-use planning
Page 12, box 2, points 1,2,3,4,5,6,7: Safe road infrastructure
Page 15, box 4, points 1, 3, 4: Safe Road Use
Global Road Safety Performance Targets
Page 3:
Page 4:
Academic Expert Group of the 3rd Ministerial Conference on Global Road Safety
Recommendation 1: Page 7 and 28: “SUSTAINABLE PRACTICES AND REPORTING: including road safety interventions across sectors as part of SDG contributions.”
“In order to ensure the sustainability of businesses and enterprises of all sizes, and contribute to achievement of a range of Sustainable Development Goals including those concerning climate, health, and equity, we recommend that these organizations provide annual public sustainability reports including road safety disclosures, and that these organizations require the highest level of road safety according to Safe System principles in their internal practices, in policies concerning the health and safety of their employees, and in the processes and policies of the full range of suppliers, distributors and partners throughout their value chain or production and distribution system.“
Recommendation 2: Page 7 and 34: “PROCUREMENT: utilizing the buying power of public and private organizations across their value chains.
“In order to achieve the Sustainable Development Goals addressing road safety, health,
climate, equity and education, we recommend that all tiers of government and the private sector prioritize road safety following a Safe System approach in all decisions, including the specification of safety in their procurement of fleet vehicles and transport services, in requirements for safety in road infrastructure investments, and in policies that incentivize safe operation of public transit and commercial vehicles.“
Recommendation 3: Page 7 and 37: “MODAL SHIFT: moving from personal motor vehicles toward safer and more active forms of mobility.
“In order to achieve sustainability in global safety, health and environment, we recommend that nations and cities use urban and transport planning along with mobility policies to shift travel toward cleaner, safer and affordable modes incorporating higher levels of physical activity such as walking, bicycling and use of public transit.“
Recommendation 4: Page 7 and 41: CHILD AND YOUTH HEALTH: encouraging active mobility by building safer roads and walkways.
“In order to protect the lives, security and well-being of children and youth and ensure the education and sustainability of future generations, we recommend that cities, road authorities and citizens examine the routes frequently traveled by children to attend school and for other purposes, identify needs, including changes that encourage active modes such as walking and cycling, and incorporate Safe System principles to eliminate risks along these routes.“
Recommendation 5: Page 7 and 44: INFRASTRUCTURE: realizing the value of Safe System design as quickly as possible.
“In order to realize the benefits that roads designed according to the Safe System approach will bring to a broad range of Sustainable Development Goals as quickly
and thoroughly as possible, we recommend that governments and all road authorities
allocate sufficient resources to upgrade existing road infrastructure to incorporate Safe System principles as soon as feasible.”
Recommendation 7: Page 7 and 52: ZERO SPEEDING: protecting road users from crash forces beyond the limits of human injury tolerance.
“In order to achieve widespread benefits to safety, health, equity, climate and quality of life, we recommend that businesses, governments and other fleet owners practice a zero-tolerance approach to speeding and that they collaborate with supporters of a range of Sustainable Development Goals on policies and practices to reduce speeds to levels that are consistent with Safe System principles using the full range of vehicle, infrastructure, and enforcement interventions.“
Recommendation 8: Page 7 and 56: 30 KM/H: mandating a 30 km/h speed limit in urban areas to prevent serious injuries and deaths to vulnerable road users when human errors occur.
“In order to protect vulnerable road users and achieve sustainability goals addressing
livable cities, health and security, we recommend that a maximum road travel speed limit of 30 km/h be mandated in urban areas unless strong evidence exists that higher speeds are safe.“
Recommendation 9: Page 7 and 59: TECHNOLOGY: bringing the benefits of safer vehicles and infrastructure to lowand middle-income countries.
“In order to quickly and equitably realize the potential benefits of emerging technologies to road safety, including, but not limited to, sensory devices, connectivity methods and artificial intelligence, we recommend that corporations and governments incentivize the development, application and deployment of existing and future technologies to improve all aspects of road safety from crash prevention to emergency response and trauma care, with special attention given to the safety needs and social, economic and environmental conditions of low- and middle-income nations.“
Page 14: Speed management
“Establish and enforce speed limit laws nationwide, locally and in cities
Build or modify roads which calm traffic, e.g. roundabouts, road narrowing, speed bumps, chicanes and rumble strips
Require car makers to install new technologies, such as intelligent speed adaptation, to help drivers keep to speed limits”
Page 14: Leadership on road safety
“Create an agency to spearhead road safety
Develop and fund a road safety strategy
Evaluate the impact of road safety strategies
Monitor road safety by strengthening data systems
Raise awareness and public support through education and campaigns”
Page 14: Infrastructure design and improvement
“Provide safe infrastructure for all road users including sidewalks, safe crossings, refuges, overpasses and underpasses
Put in place bicycle and motorcycle lanes
Make the sides of roads safer by using clear zones, collapsible structures or barriers
Design safer intersections
Separate access roads from through-roads
Prioritize people by putting in place vehicle-free zones
Restrict traffic and speed in residential, commercial and school zones
Provide better, safer routes for public transport”
A/RES/76/294 Political Declaration of the High-Level Meeting on Improving Global Road Safety
Page 3-5:
“1. Drive the implementation of the Global Plan for the Decade of Action for Road Safety 2021–2030, which describes key suggested actions to achieve the reduction in road traffic deaths of at least 50 per cent by 2030 and calls for setting national targets to reduce fatalities and serious injuries for all road users with special attention given to the safety needs of those road users who are the most vulnerable to road-related crashes, including pedestrians, cyclists, motorcyclists and users of public transport, taking into account national circumstances, policies and strategies;
2. Develop and implement regional, national and subnational plans that may include road safety targets or other evidence-based indicators where they have been set, and put in place evidence-based implementation processes by adopting a whole-of-government and whole-of-society approach and designating national focal points for road safety with the establishment of their networks in order to facilitate cooperation with the World Health Organization to track progress towards the implementation of the Second Decade of Action for Road Safety 2021–2030;
4. Implement a Safe System approach through policies that foster safe urban and rural road infrastructure design and engineering; set safe adequate speed limits supported by appropriate speed management measures; enable multimodal transport and active mobility; establish, where possible, an optimal mix of motorized and non-motorized transport, with particular emphasis on public transport, walking and cycling, including bike-sharing services, safe pedestrian infrastructure and level crossings, especially in urban areas;
5. Adopt evidence- and/or science-based good practices for addressing key risk factors, including the non-use of seat belts, child restraints and helmets, medical conditions and medicines that affect safe driving, driving under the influence of alcohol, narcotic drugs and psychotropic and psychoactive substances, inappropriate use of mobile phones and other electronic devices, including texting while driving, speeding, driving in low visibility conditions, driver fatigue, as well as the lack of appropriate infrastructure; and for enforcement efforts, including road policing, coupled with awareness and education initiatives, supported by infrastructure designs that are intuitive and favour compliance with legislation and a robust emergency response and post-crash care system;
6. Ensure that road infrastructure improvements and investments are guided by an integrated road safety approach that, inter alia, takes into account the connections between road safety and eradication of poverty in all its dimensions, physical health, including visual impairment and mental health issues, the achievement of universal health coverage, economic growth, quality education, reducing inequalities within and among countries, gender equality and women’s empowerment, decent work, sustainable cities, environment and climate change, as well as the broader social determinants of road safety and the interdependence between Sustainable Development Goals and targets that are integrated, interlinked and indivisible, and assures minimum safety performance standards for all road users;
9. Integrate a gender perspective into all policymaking and implementation of transport policies that provide for safe, secure, inclusive, accessible, reliable and sustainable mobility, and non-discriminatory participation in transport; and ensure that policies cater to road users who might be in vulnerable situations, in particular children, youth, older persons and persons with disabilities;
10. Deliver evidence-based road safety knowledge and awareness programmes to promote a culture of safety among all road users and to address high-risk behaviours, especially among youth, and the broader road-using community through advocacy, training and education and encourage private sector participation in supplementing national efforts in promoting greater road safety awareness as part of corporate social responsibility;
13. Promote capacity-building, knowledge-sharing, technical support and technology transfer programmes and initiatives on mutually agreed terms in the area of road safety, especially in developing countries, which confront unique challenges and, where possible, the integration of such programmes and initiatives into sustainable development assistance programmes through North-South, South-South and triangular cooperation formats, as well as public-private collaboration;
14. Promote the development, knowledge-sharing and deployment of vehicle automation and new technologies in traffic management using both intelligent transport systems and cooperative intelligent transport systems, in line with national requirements, to improve accessibility and all aspects of road safety while also monitoring, assessing, managing and mitigating challenges associated with rapid technological change and increasing connectivity;
17. Request the Secretary-General to provide, in consultation with the World Health Organization and other relevant agencies, a progress report during the seventy-eighth and eightieth sessions of the General Assembly, including recommendations on the implementation of the present declaration towards improving global road safety, which will serve to inform the high-level meeting to be convened in 2026;“
[1] Our definition is based on the following sources:
[2] In many countries, guidelines direct where and how to apply the speed limit. Speed zoning guidelines may exist in addition to relevant speed limit laws or may exist without speed limit law.
[3]World Health Organization. (2021). Global Plan for the Decade of Action for Road Safety 2021-2030.
[4] Elvik, R. (2009). The Power Model of the relationship between speed and road safety. The Institute of Transport Economics.
[5] International Transport forum. (2018). Speed and Crash Risk. International Traffic Safety
Data and Analysis Group Research Report.
[6] National Association of City Transportation Officials. (2018). Speed Kills. In, City Limits; Setting Safe Speed Limits on Urban Roads.
[7] National Association of City Transportation Officials. (2018). Speed Kills. In, City Limits; Setting Safe Speed Limits on Urban Roads.
[8] Sharpin, A.B., Banerjee, S.R., Adriazola-Steil, C., & Welle, B. (2017). The Need for (Safe) Speed: 4 Surprising Ways Slower Driving Creates Better Cities. World Resources Institute.
[9] Global Road Safety Facility. (2023). Speed Management Hub – Frequently Asked Questions, Note 8.2.
[10] Transportation Alternatives New York. Too Fast, Too Furious; New York City’s Speeding Epidemic and the Case for Local Control of Speed Limits.
[11] Farmer, C.M. (2019). The effects of higher speed limits on traffic fatalities in the United States, 1993–2017. Insurance Institute for Highway Safety.
[12] Seattle Department of Transportation. (2022). Speed Limits.
[13] Sharpin, A.B, Adriazola-Steil, C., Job, S., et al. (2021). Low-Speed Zone Guide. World Resources Institute and The Global Road Safety Facility.
[14] Insurance Institute for Highway Safety. (2021), New crash tests show modest speed increases can have deadly consequences.
[15] Job, S. & Sakashita, C. (2016). Management of speed: The low-cost, rapidly implementable effective road safety action to deliver the 2020 road safety targets. Journal of Road Safety, 27(2), 65–70.
[16] Steinbach, R., Perkins, C., Edwards, P., Beecher, D., Roberts, I. (2016). Speed Cameras to Reduce Speeding Traffic and Road Traffic Injuries. What Works: Crime Reduction Systematic Review Series. [No 8]. Cochrane Injuries Group, London School of Hygiene & Tropical Medicine.
[17] Decina, L.E., Thomas, L., Srinivasan, R. (2007). Automated enforcement: A compendium of worldwide evaluations of results. Office of Research and Technology, National Highway Traffic Safety Administration, Washington DC, 20590, Issue DOT HS 810 763
[18] Job, S., Cliff, D, Fleiter, J.J., Flieger, M., & Harman, B. (2020). Guide for Determining Readiness for Speed Cameras and Other Automated Enforcement. Global Road Safety Facility and the Global Road Safety Partnership, Geneva, Switzerland.
[19] Morain, S.R., Gielen, A.C., & Bhalla, K. (2016). Automated speed enforcement systems to reduce traffic-related injuries: closing the policy implementation gap. Injury Prevention;22:79-83.
[20] P99 & 100, Sharpin, A.B., Adriazola-Steil, C., Luke, N., Job, S., Obelheiro, M., Bhatt, A., Liu, D., Imamoglu, T., Welle, B., & Lleras, N. (2021). LOW-SPEED ZONE GUIDE. Bloomberg Philanthropies.
[21] World Road Association. (2019). The Safe System Approach – Road Safety Manual: A Manual for Practitioners and Decision Makers on Implementing Safe System Infrastructure.
[22] International Transport Forum. (2008), Towards Zero: Ambitious Road Safety Targets and the Safe System Approach, OECD Publishing, Paris.
[23] Welle, B., Sharpin, A.B., Adriazola-Steil, C., Job, S., Shotten, M., Bose, D., Bhatt, A., Alveano, S., Obelheiro, M., & Imamoglu, C.T. (2018). Sustainable & Safe: A Vision and Guidance for Zero Road Deaths. World Resources Institute.
[24] World Bank. (2017). The High Toll of Traffic Injuries: Unacceptable and Preventable. World Bank.
[25] Job, R.F.S. & Mbugua, L.W. (2020). Road Crash Trauma, Climate Change, Pollution and the Total Costs of Speed: Six graphs that tell the story. GRSF Note 2020.1. Washington DC: Global Road Safety Facility, World Bank.
[26] European Environment Agency. (2020). Do lower speed limits on motorways reduce fuel consumption and pollutant emissions? European Environment Agency.
[27] Williams, D. & North, R. (2013). An evaluation of the estimated impacts on vehicle emissions of a 20mph speed restriction in central London. Transport and Environmental Analysis Group, Centre for Transport Studies, Imperial College London.
[28] Job, R.F.S. & Mbugua, L.W. (2020). Road Crash Trauma, Climate Change, Pollution and the Total Costs of Speed: Six graphs that tell the story. GRSF Note 2020.1. Washington DC: Global Road Safety Facility, World Bank.
[29] Global Road Safety Facility. (2023). Speed Management Hub – Frequently Asked Questions, Note 8.2.
[30] Global Road Safety Facility. (2023). Speed Management Hub – Frequently Asked Questions, Note 8.2.
[31] Estadao. (2015). Number of accidents drops 30% after new limits on Marginal roads
[32] The European Federation for Transport and Environment (2001). Lower urban speed limits Better for citizens, better for the environment, better for all.
[33] P. 14, ITF. (2021). Road Safety in Cities: Street Design and Traffic Management Solutions. International Transport Forum Policy Papers, 99, OECD Publishing, Paris.
[34] Núcleo de Gestão da Informação (NGI). (2022). Análise Da Adequação Dos Limites De Velocidades Nas Vias De Fortaleza-Ce.
[35] Millot, M. & Violette, E. (2020). Lowering the speed limit to 80 km/h Assessment – 18-month items. Cerema Transport Infrastructures, January.
[36] P. 12-18, Narelle, H., Ungers, B., Vulcan, P., & Bruce, C. (2001). Evaluation of a 50 km/h Default Urban Speed Limit for Australia. Melbourne, Monash University Accident Research Centre, November.
[37] P. 29-31, OECD/International Transport Forum. (2018). Speed and crash risk. ITF (International Transport Forum), 82p.
[38] P. 43-44, OECD/International Transport Forum. (2018). Speed and crash risk. ITF (International Transport Forum), 82p.
[39] P. 45-48, OECD/International Transport Forum. (2018). Speed and crash risk. ITF (International Transport Forum), 82p.
[40] Sharpin, A.B, Adriazola-Steil, C., Job, S., et al. (2021). Low-Speed Zone Guide. World Resources Institute and The Global Road Safety Facility
[41] Global Designing Cities Initiative. (2016). Global Street Design. Island Press; 2nd None ed. edition
[42] National Association of City Transportation Officials. (2018). City Limits; Setting Safe Speed Limits on Urban Roads
[43] International Road Assessment Programme, iRAP. (2022). The Road Safety Toolkit.
[44] Job, S., Cliff, D, Fleiter, J.J., Flieger, M., & Harman, B. (2020). Guide for Determining Readiness for Speed Cameras and Other Automated Enforcement. Global Road Safety Facility and the Global Road Safety Partnership, Geneva, Switzerland
![]()
![]()
© 2023 Global Alliance of NGOs for Road Safety Privacy Policy | Terms of Use